Proactive Defense Metrics for OT Security: How to Measure What’s Working


Proactive defense in OT is easy to support in principle and hard to prove in practice. Leaders ask for ROI, auditors ask for evidence, and engineers ask whether changes will disrupt production. Meanwhile many OT security teams end up reporting what is easiest to count: vulnerabilities, patch totals, or tool deployments. Those numbers rarely answer the commercial question that matters: did we reduce the likelihood and impact of a real intrusion on critical processes?
This guide provides a practical, metrics-driven way to measure proactive defense in operational technology environments, including ICS, SCADA, and safety-critical systems. It focuses on metrics that demonstrate improvement over time, connect to attack paths and operational risk, and can be validated safely. If you are building or refining your program, start with the core concepts in A Proactive Defense Framework for Critical Infrastucture and then use the metrics below to operationalize it.
Frenos is purpose-built for OT environments where testing on production is not acceptable. By using digital twins and continuous security validation, Frenos can validate full attack paths and control effectiveness without touching production systems. That matters because the strongest metrics are not self-reported. They are measured through safe, repeatable validation, so you can show leadership exactly what improved and why. For context on the zero-disruption approach, see Why Frenos Won the DataTribe Challenge.
Definition: What “Proactive Defense” Means in OT
In OT security, proactive defense is the practice of reducing exploitable pathways to critical functions before an incident occurs, and continuously validating that controls still work as the environment changes. It is not just “finding vulnerabilities early” or “running a pentest annually.” It is a measurable operating model that ties together attack-path analysis, control validation, detection readiness, and remediation prioritization.
A useful way to define proactive defense for industrial environments is: the ability to demonstrate, with repeatable evidence, that a realistic adversary’s path from initial access to process impact is getting harder over time, while your ability to detect and respond is getting faster.
This definition matters because it implies metrics. If you cannot measure attack-path difficulty, control effectiveness, detection performance, and remediation outcomes, you cannot credibly claim improvement. It also implies a testing method appropriate for OT. In many plants, you cannot safely validate assumptions on live systems. That is why approaches such as digital twins and continuous validation are becoming central to measurable proactive defense.
Why Vulnerability Counts Are Poor Proactive Defense Metrics
Vulnerability metrics are often the default because they are available: number of CVEs, number of criticals, patch compliance, mean CVSS score, and so on. The problem is not that vulnerabilities are irrelevant. The problem is that counts and averages are weak proxies for real-world risk in OT.
First, OT exploitability is context-dependent. A critical CVE on an isolated HMI with strong allowlisting may represent less risk than a medium CVE on an engineering workstation that can reach a safety PLC. Second, counting vulnerabilities encourages perverse incentives: teams can improve the metric by scanning more assets (counts go up) or by suppressing findings (counts go down), without any meaningful change in security.
Third, many OT constraints make “patch faster” an incomplete strategy. Maintenance windows are limited, vendor support can lag, and risk acceptance is sometimes appropriate when compensating controls are effective. A program that can prove compensating controls block exploitation is often safer than a program that chases patch counts without understanding attack paths.
A better approach is to keep vulnerability data, but elevate it into metrics that answer: Can an adversary use this weakness to move toward a high-consequence outcome, and did we measurably reduce that possibility? That is the shift from volume-based reporting to proactive defense metrics.
- Replace “total vulnerabilities” with “exploitable vulnerabilities on validated attack paths to critical assets.”
- Replace “patch compliance” with “time-to-risk-reduction,” including mitigations that break the attack path.
- Replace “CVSS averages” with “consequence-weighted exposure,” tied to process impact and safety considerations.
- Report vulnerabilities as a supporting metric, not the headline KPI for program effectiveness.
A Metrics Model That Leadership and Engineers Both Accept
The strongest OT security programs report metrics that meet three criteria: they reflect realistic adversary behavior, they map to business and operational risk, and they can be measured consistently over time without disrupting operations.
A practical model is to organize proactive defense metrics into five categories:
1) Attack-path reduction: are we making it harder to reach high-consequence targets? 2) Detection effectiveness: would we see the behavior that matters, quickly enough to act? 3) Validation coverage: what portion of the environment and control set have we actually tested, not just assumed? 4) Time-to-remediation: how fast do we reduce real risk after discovering a problem? 5) Control effectiveness: are the controls working as designed, in the ways attackers try to bypass them?
These categories align with the reality that OT security is a system of systems. You can have strong segmentation and weak identity controls, or good monitoring and poor asset hardening. A single metric rarely tells the full story. A small, stable set of KPIs across these categories is what enables executive reporting and operational prioritization.
If you are already using an OT security platform for posture management and validation, the key is to configure it around these categories rather than around tool-specific outputs. For a view of how continuous measurement fits into OT programs, see Continuous OT Security Posture Management (OT-SPM) Platform.
Measuring Attack-Path Reduction (The Metric Executives Actually Want)
Attack-path reduction is the most direct way to express proactive defense outcomes: fewer feasible paths to high-consequence targets, fewer steps required to stop an adversary, and smaller blast radius if they gain a foothold.
In OT, an “attack path” is not theoretical. It is typically a chain involving IT-OT connectivity, remote access, engineering workstations, shared services (AD, DNS, jump hosts), OT management networks, and ultimately control assets like PLCs, SIS, and SCADA servers. The goal is not to eliminate all paths, which is rarely feasible. The goal is to ensure that paths to the highest-risk assets are heavily constrained, well-monitored, and resilient to single-control failures.
Key to measuring this category is to avoid binary statements like “segmented” or “not segmented.” Instead, treat segmentation, identity, and access controls as measurable barriers that either break a path or allow it.
Attack-path metrics become significantly more credible when they are validated through safe testing methods rather than inferred from network diagrams. Frenos is designed to map and validate full attack paths through digital twins, allowing repeatable testing without touching production systems. That provides evidence you can trend over time and present to leadership as risk reduction rather than tool activity.
- Number of validated attack paths to top-tier critical assets (trend down over time).
- Median and minimum “controls to impact” for critical scenarios (trend up over time). This is the count of independent barriers an attacker must defeat.
- Attack-path “choke point” coverage: percentage of paths that must traverse monitored and controlled enforcement points (jump servers, firewalls, allowlisting boundaries).
- Blast radius index: estimated number of control assets reachable from a likely initial access point, weighted by consequence.
- High-risk path closure rate: percentage of highest-risk paths remediated within a defined period after discovery.
How to Quantify Attack-Path Risk Without Guesswork
To quantify attack-path risk, you need a consistent scoring approach that does not collapse into generic IT metrics. A practical method is to score paths based on three dimensions:
1) Consequence: what happens if the path reaches its target? Consider production loss, safety implications, environmental impact, and regulatory exposure. 2) Feasibility: how realistic is the path given existing access, credentials, segmentation, and attacker capabilities? 3) Detectability: if an attacker attempted this path, how likely are you to see it in time to intervene?
Each dimension can be scored on a simple scale (for example 1 to 5) so you can prioritize remediation and trend improvements. The value comes from consistency, not from false precision.
Avoid scoring that depends entirely on CVSS or on subjective opinions. Use observable conditions: presence of unidirectional gateways, enforced MFA on remote access, allowlisting on engineering workstations, firewall rule specificity, credential hygiene, and validated detection telemetry.
The output should be a ranked list of scenarios and paths. That list becomes your proactive defense backlog: the specific technical changes and validations that will measurably reduce the highest-risk paths first.
- List your top consequence targets: safety systems, high-value production lines, central SCADA, historian interfaces, and critical PLC groups.
- Define 5 to 10 realistic initial access scenarios: compromised vendor credentials, phishing into corporate, exposed remote access appliance, infected laptop brought onsite, misuse of engineering workstation access.
- For each scenario, map the path steps to target and identify required control bypasses.
- Score consequence, feasibility, and detectability using observable conditions.
- Select the top paths and track path closure and residual risk over time.
Measuring Detection Effectiveness in OT (Beyond Alert Counts)
Detection metrics in OT often degrade into “number of alerts,” “number of use cases,” or “coverage by sensor.” Those measures can hide the real question: can you detect the behaviors that enable process impact, and can you respond within the time constraints of industrial operations?
Detection effectiveness should be measured against behaviors, not tools. For example: unauthorized logic upload attempts, abnormal workstation-to-PLC communications, new remote access sessions at unusual times, lateral movement between OT zones, modifications to historian interfaces, or changes in engineering project files.
Because OT networks can be noisy and fragile, detection quality matters as much as detection presence. Excessive false positives cause operators and security teams to ignore alerts, and in some plants SOC-driven containment actions can introduce operational risk. Detection effectiveness metrics should therefore include both timeliness and fidelity.
Continuous validation strengthens these metrics. If you can safely emulate attacker behaviors in a digital twin and confirm that detection triggers as expected, you can report detection readiness with evidence rather than assumptions. For additional context on why reactive detection-only approaches fall short in critical environments, see Why Reactive Security Fails Critical Infrastructure: The Case for Proactive Defense.
- Mean time to detect (MTTD) for high-consequence behaviors, measured in controlled validations where possible.
- Detection rate for tested behaviors: percentage of validated adversary techniques that generate a high-confidence alert.
- Time to triage: time from alert creation to analyst classification as benign, suspicious, or incident.
- False positive burden: percentage of alerts closed as non-actionable, tracked per use case.
- Containment readiness: percentage of critical scenarios where a safe containment playbook exists and has been exercised.
Measuring Security Validation Coverage (What Have You Actually Tested?)
Validation coverage is the metric category that prevents false confidence. Many OT security programs assume controls work because they are deployed. In practice, configurations drift, exceptions are added, vendor connections change, and new assets appear. Without validation, you do not know if a path is truly blocked or if a detection rule actually fires.
Validation coverage answers: what proportion of your environment and your defensive assumptions have been tested with repeatable methods?
In OT, validation must respect safety and uptime constraints. That often rules out aggressive live testing on production networks. Frenos addresses this through safe testing using digital twins, enabling full-scope security testing without touching production systems. This is particularly useful for plants that want to validate complex paths involving engineering workstations, remote access, and control network segmentation without risking disruption.
Coverage should be reported in a way that discourages shallow checkbox testing. For example, “we ran scans on 80% of assets” is not the same as “we validated top attack paths to all tier-1 assets and tested the controls that should block them.”
- Asset validation coverage: percentage of tier-1 and tier-2 assets included in attack-path mapping and validation.
- Technique coverage: percentage of priority adversary techniques for your sector that have been tested for detectability and preventability.
- Control validation coverage: percentage of critical controls (segmentation, remote access, allowlisting, backup and restore, logging) that have been tested against defined failure modes.
- Path validation coverage: percentage of high-risk paths that have been validated end-to-end, not just inferred from diagrams.
- Change-triggered validation rate: percentage of significant OT changes (new vendor access, firewall rule changes, new engineering workstation images) that trigger re-validation within a defined SLA.
FAQs
Prioritize metrics that demonstrate risk reduction and readiness: (1) number of validated attack paths to tier-1 assets, (2) controls-to-impact for critical scenarios, (3) detection rate and MTTD for high-consequence behaviors, (4) validation coverage across tier-1 assets and priority techniques, and (5) time-to-risk-reduction for high-risk findings.
Treat vulnerabilities as inputs, not outcomes. Measure posture by mapping and validating attack paths to high-consequence targets, then tracking whether paths are blocked by effective controls and whether the relevant behaviors are detected. Report trends: fewer feasible paths, higher barriers to impact, faster detection, and faster risk reduction after findings.
Yes. In many OT environments, production testing is unsafe or unacceptable. You can still measure proactive defense using safe validation approaches such as digital twins, which allow realistic attack-path and control testing without touching production. Pair this with configuration and change management verification to ensure validated improvements are reflected in production.
Executives respond to metrics tied to operational risk: validated attack-path exposure to critical assets, evidence that defenses are improving (controls-to-impact and detection readiness), and execution metrics that show accountability (time-to-risk-reduction and aging of high-risk items). Include validation coverage to communicate confidence in the numbers.
At minimum, re-validate after meaningful changes such as new vendor access, firewall rule updates, new engineering workstation images, major process changes, or new OT integrations. Many teams set a time-based cadence as well, such as validating tier-1 assets and priority techniques every 60 to 90 days, with faster re-validation triggered by changes.
Next Steps
If you need metrics that prove your OT security program is reducing real risk, the fastest path is to validate high-consequence attack paths safely and track improvement over time. Frenos enables full-scope security testing of industrial environments without touching production systems, so you can measure attack-path reduction, control effectiveness, and detection readiness with repeatable evidence. Request an OT Security Assessment.
Related Resources

1-Day Simulated OT Pentest
Take a deep dive into understanding how Frenos' simulated OT penetration testing platform allows you to understand and improve your OT security posture at scale.
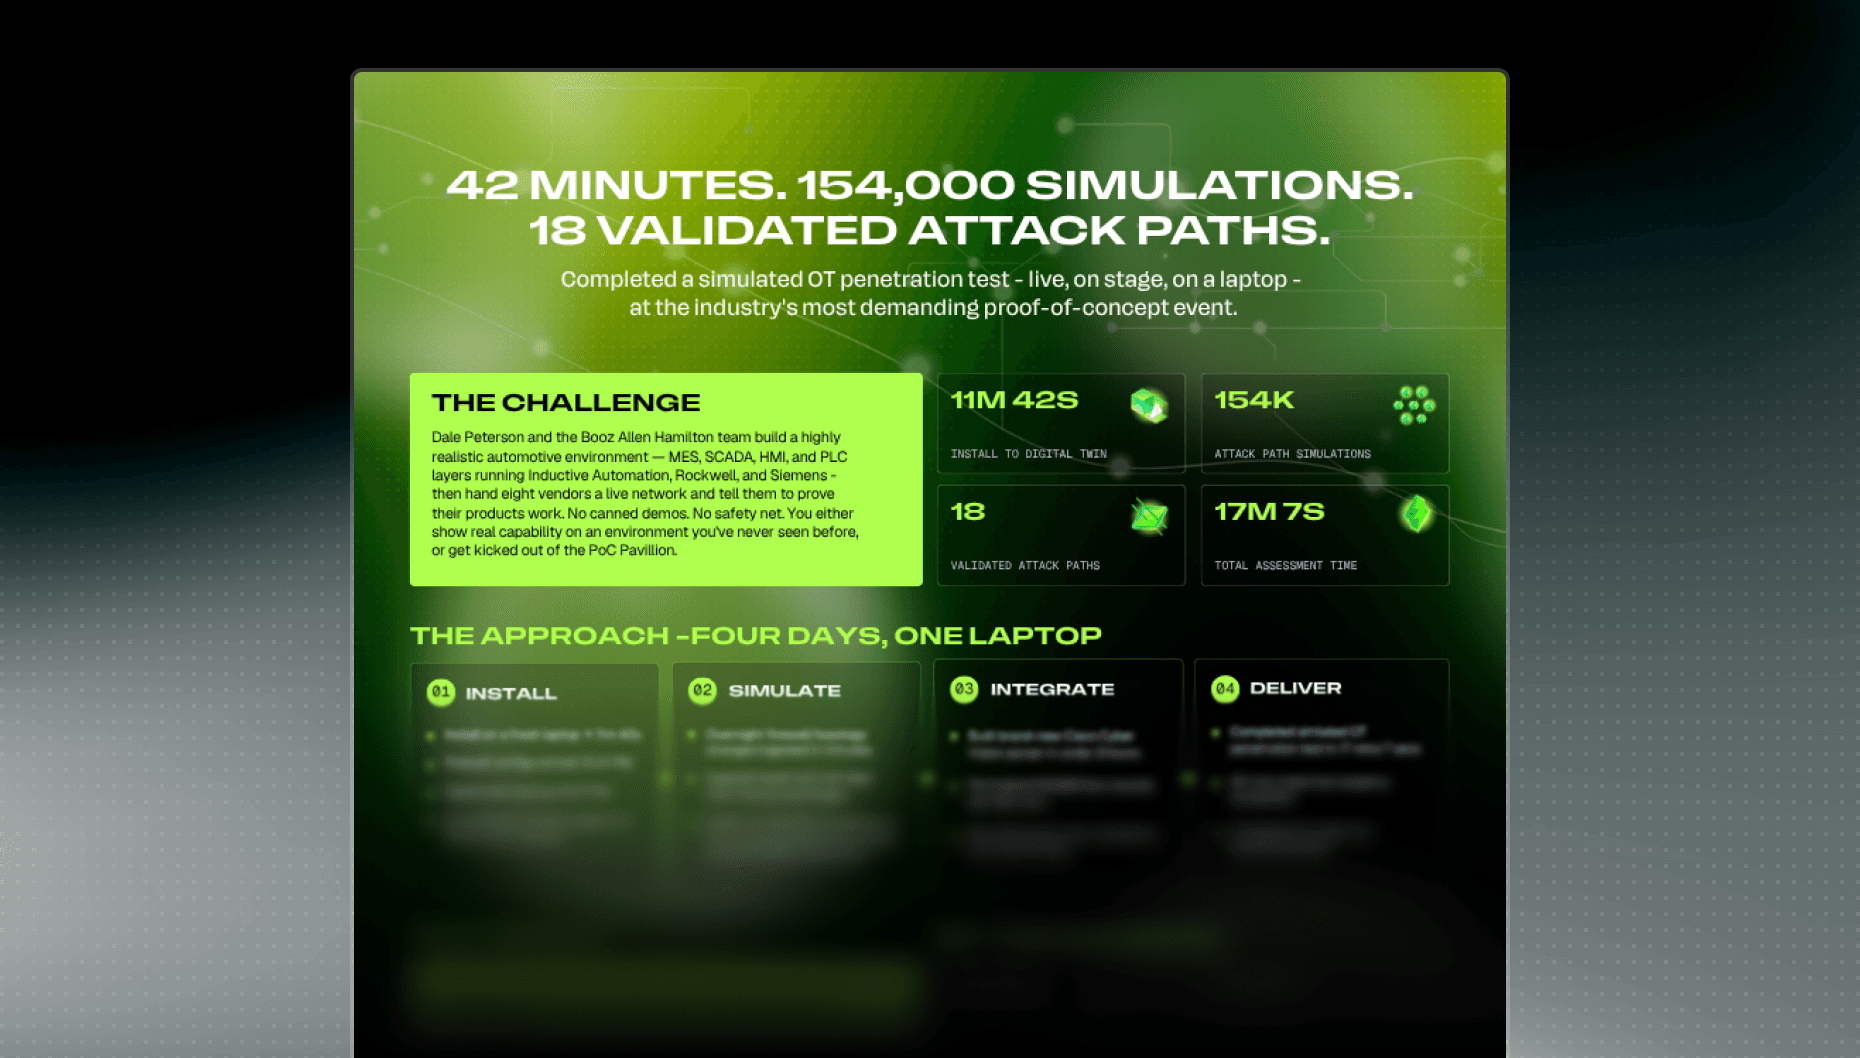
S4x26 Case Study
At the S4x26 POC Pavilion, Frenos completed 154,000 OT attack path simulations in 17 minutes and 7 seconds in a documented engagement. From three assumed-breach starting points (iDMZ, Plant Operations, Enterprise), the platform validated 18 attack paths into the critical Rockwell and Siemens zone. Those paths are exploitable given the actual controls, firewall rules, routing, and configurations modeled in the digital twin.

Threat Intelligence
Transform static threat intelligence into dynamic attack simulations. Reveal exactly how specific threat actors could compromise your OT environment before they try.